14diggsdigg40 Useful and Creative Infographics
May 10th, 2009 by Jacob Gube | 47 Comments | Stumble It! Delicious
Information graphics (or infographics) are graphical depictions of data and information. By presenting information in a compact and creative approach, infographics are able to quickly convey knowledge and engage its viewers.
In this collection, you’ll find forty beautiful and educational infographics, displaying the uncommon spectacle of "art meets science".
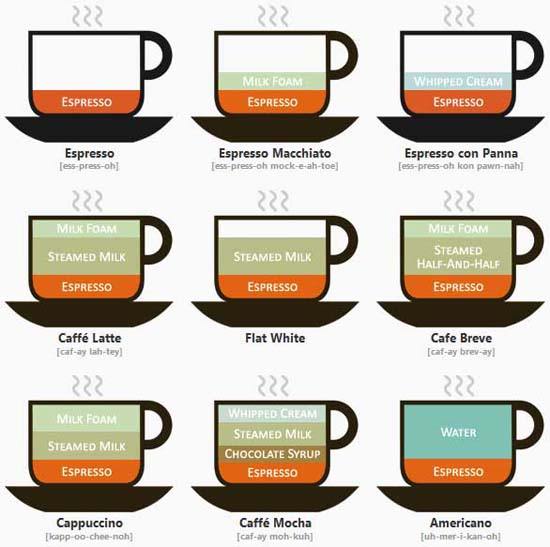
1. Coffee Drinks Illustrated
The proportion of ingredients for popular coffee drinks and their pronunciation keys.
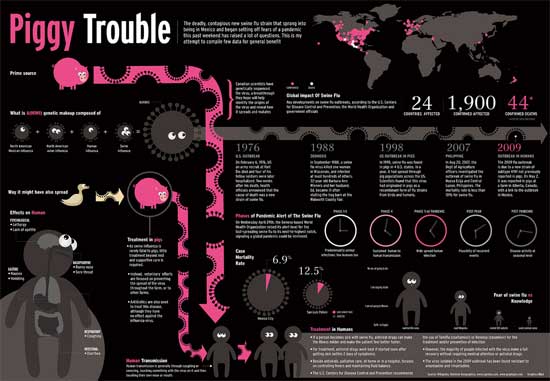
2. Piggy Trouble
This infographic showcases the history of the Swine Flu, starting from 1976.
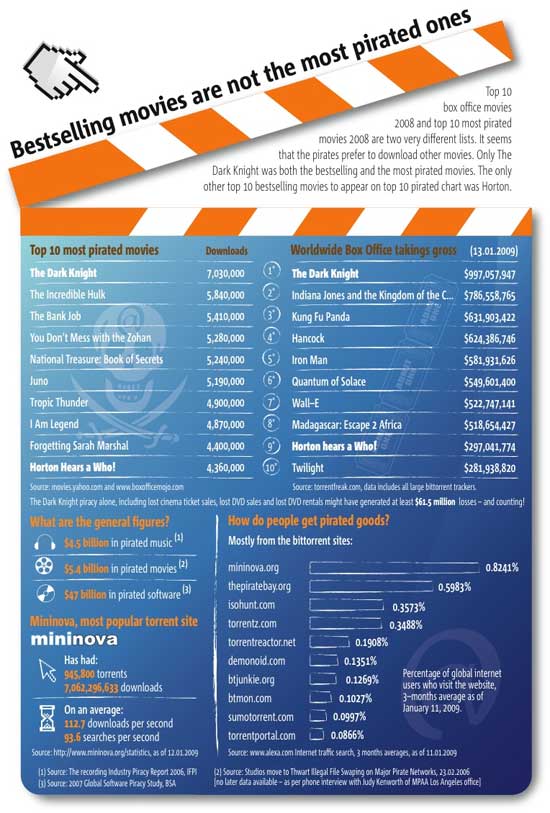
3. Best selling movies are not the most pirated ones
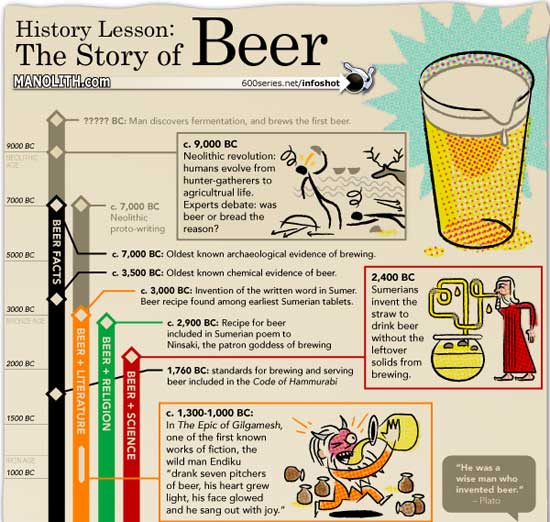
4. History Lesson: The Story of Beer
5. The Best Beer in America
The top breweries and beers in the U.S.
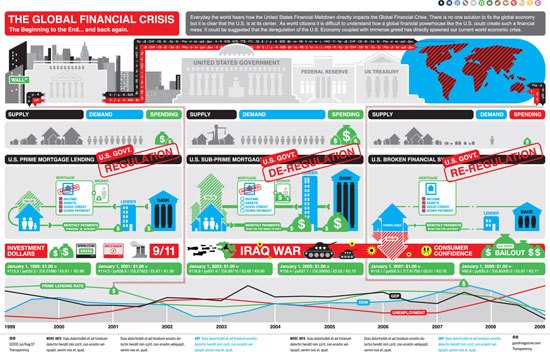
6. Making Sense of the Financial Mess: The Global Financial Crisis
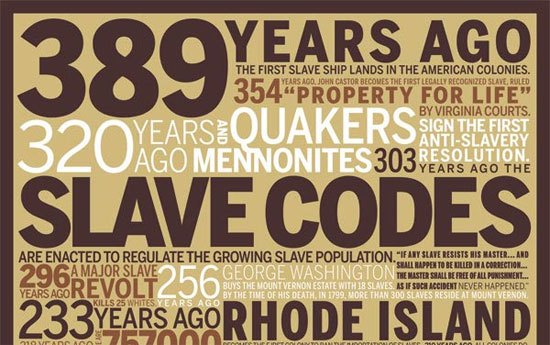
7. 389 Years Ago
A rundown of the historic events in African-American culture.
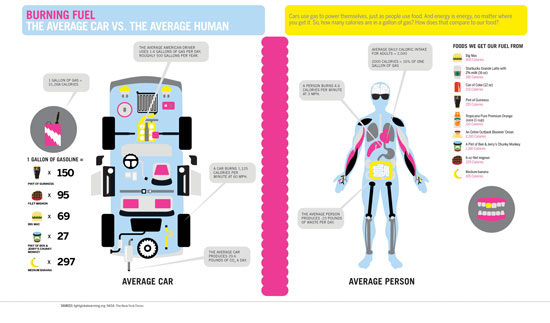
8. Burning Fuel: The Average Car vs. The Average Human
9. Our Favorite Drugs
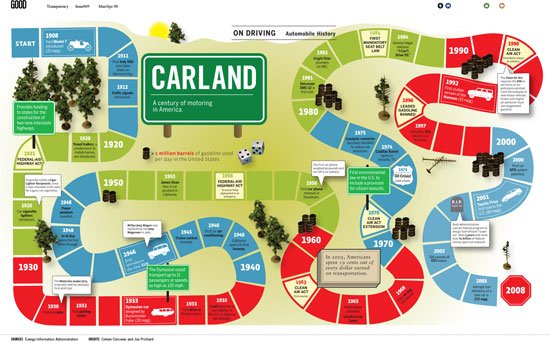
10. On Driving: Automobile History
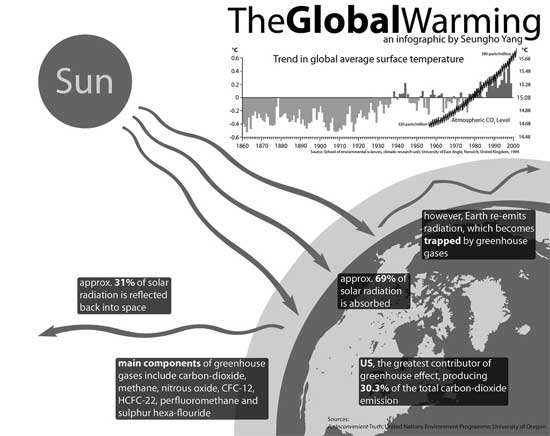
11. TheGlobalWarming Infographic
An illustrated guide at how the Global Warming phenomenon works.
12. Periodic Table of Typefaces
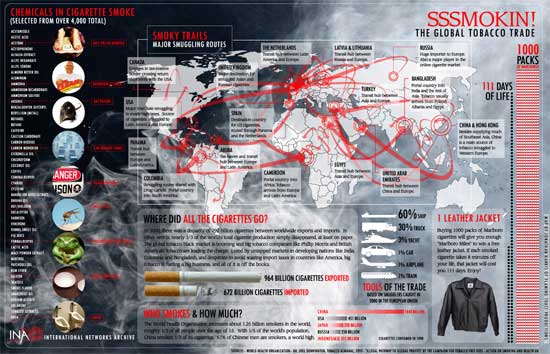
13. SSSMOKIN! The Global Tobacco Trade
A packed visual piece on tobacco chemicals and tobacco trade worldwide.
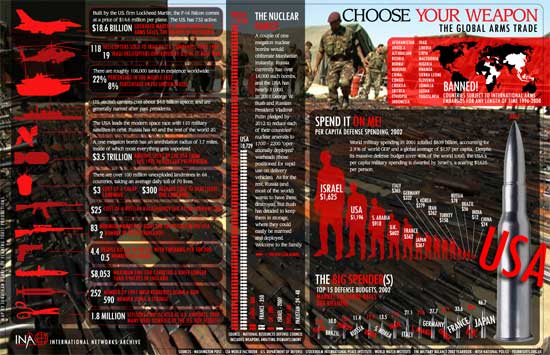
14. Choose Your Weapon: The Global Arms Trade
15. Breakdown of Average Student Budget
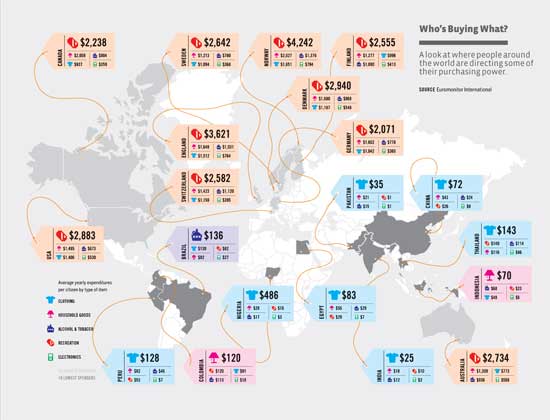
16. Who’s Buying That?
A graphical representation of consumer spending across the globe.
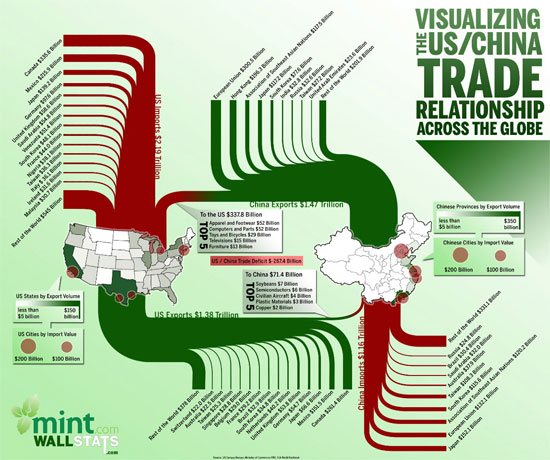
17. Visualizing the US and China Trade Relations
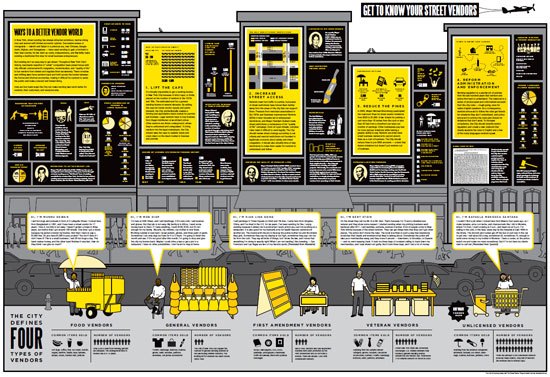
18. Get to Know Your Street Vendors
The types of street vendors you may encounter in urban cities of the U.S.
19. Where we live
The distribution of population in the U.S.
20. Who’s Coming to America?
The top nationalities that immigrate to the U.S.
21. Global Internet Traffic Flow Map
An infographic on internet information flow around the world.
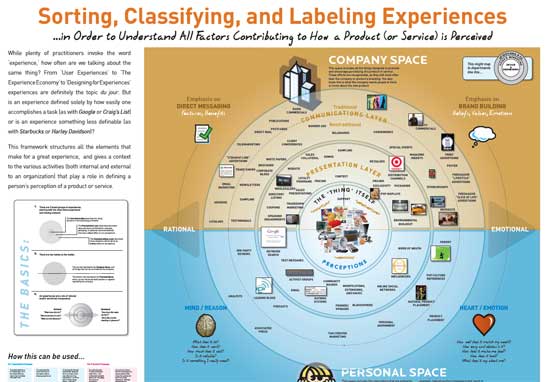
22. Classifying Experiences
This is in PDF format. An informative graphical piece on User Experience (UX).
23. Black Hawk Down
An illustrated guide to the events that happened in Somalia in 1993 when a U.S. helicopter was shot down by rebels.
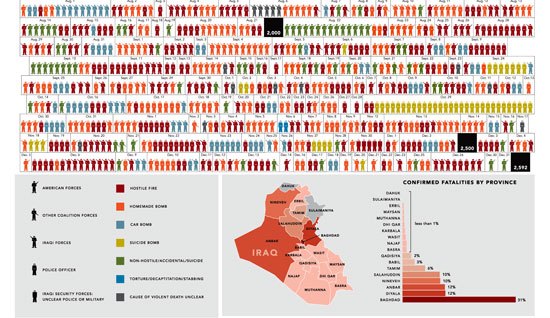
24. A Year in Iraq
A visualization of fatalities related to the War in Iraq.
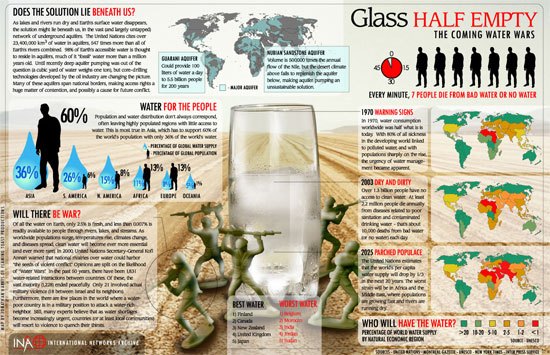
25. Glass Half Empty: The Coming Water Wars
An infographic on the global water shortage crisis.
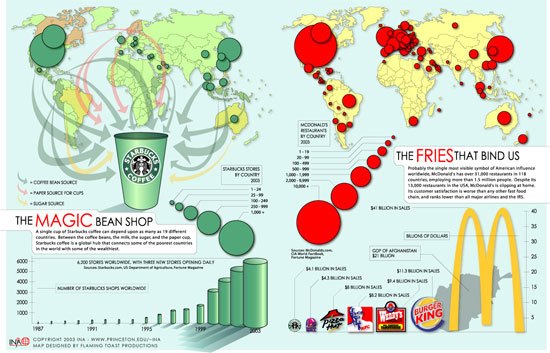
26. The Magic Bean Shop & The Fries That Bind Us
A graphical representation of how Star Bucks and Mcdonald’s are proliferating across the globe.
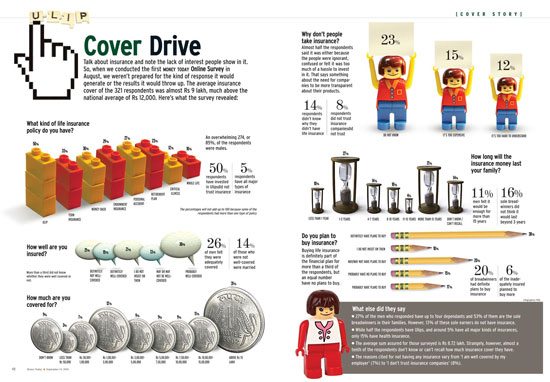
27. Cover Drive
An informative piece on insurance.
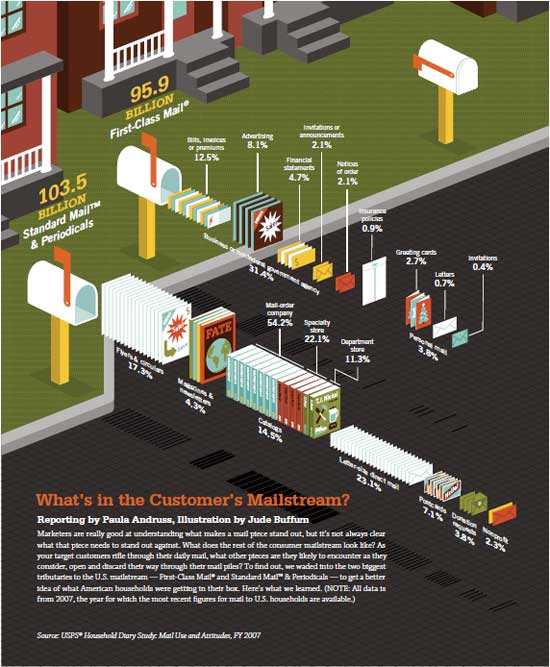
28. What’s in the Customer’s Mailstream?
This is a PDF file, infographic on page 4. This piece shows a breakdown of what people get in the mail.
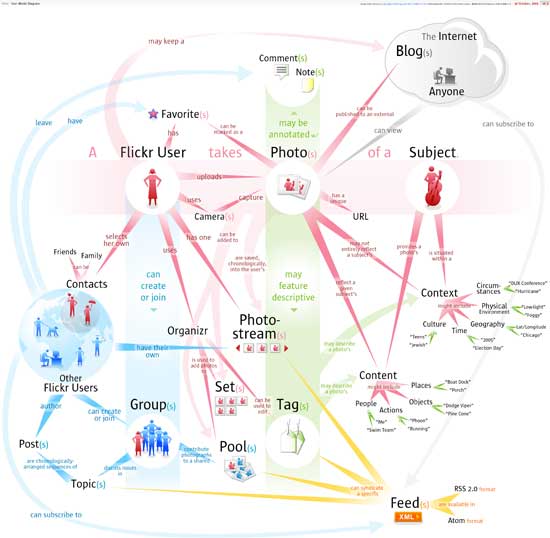
29. Flickr User Model
Networking connection of users on Flickr.
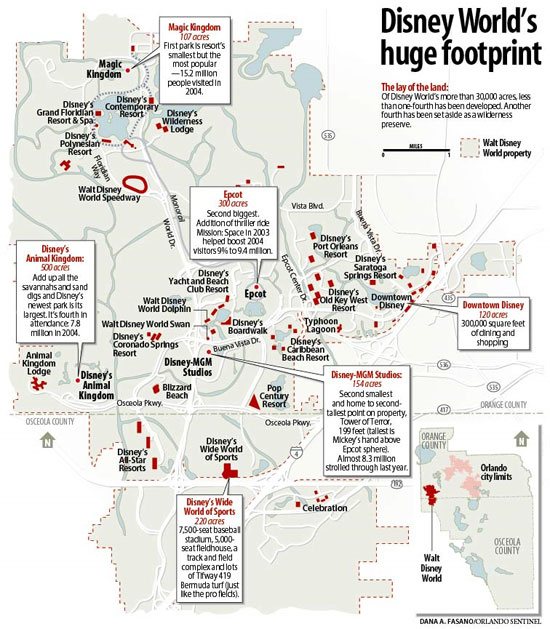
30. Disney World’s Huge Footprint
The cost in resources of Disney World operations.
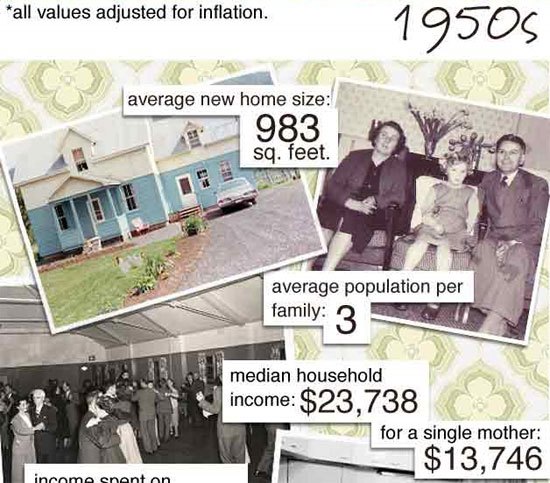
31. Evolution of the Household – 1950’s to Present
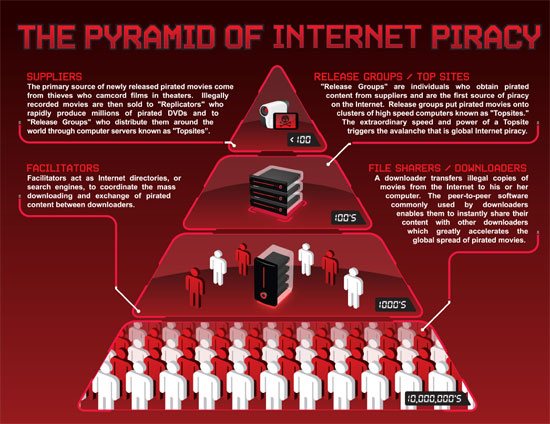
32. The Pyramid of Internet Piracy
This is a PDF file. A piece on the structure of the people participating in internet piracy.
33. Making Sense of the Financial Mess: Where Did All The Money Go?
An illustrated guide on how the financial crisis started.
34. Consumers’ Savings Behaviors
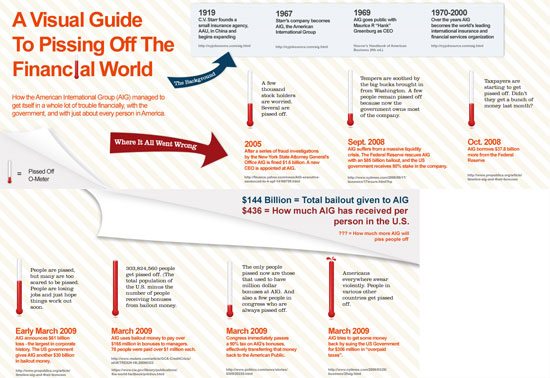
35. A Visual Guide to Pissing Off The Financial World
An infographic on the history of AIG.
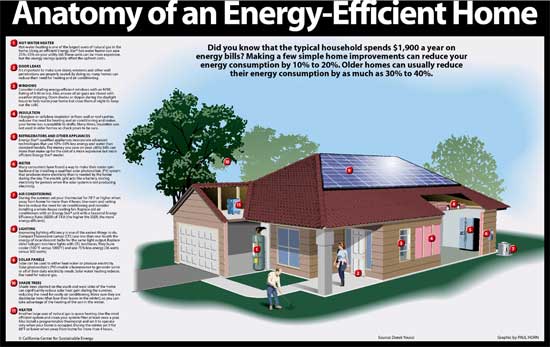
36. Anatomy of an Energy-Efficient Home
37. A Visual Guide to Inflation
38. Web Trend Map 4
A graphical representation of the top 50 most influential websites.
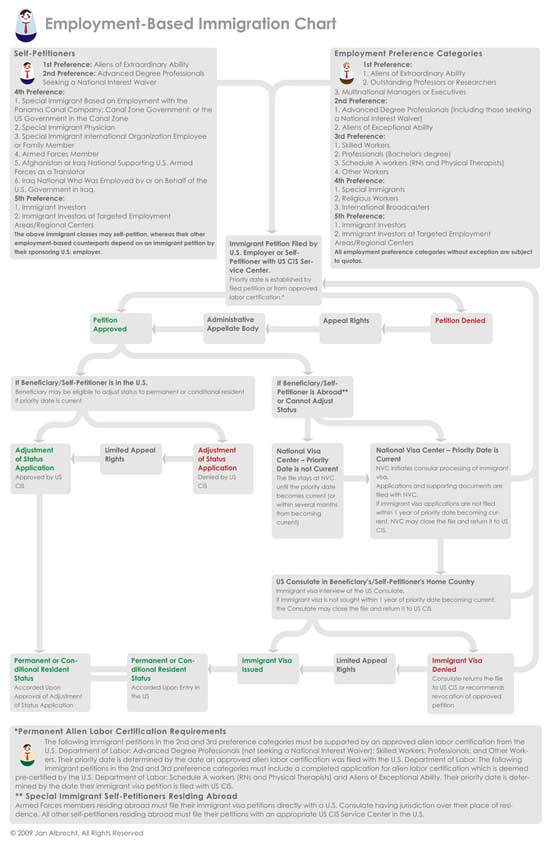
39. Employment-Based Immigration Chart
A visual guide on how to immigrate to the U.S. based on employment.
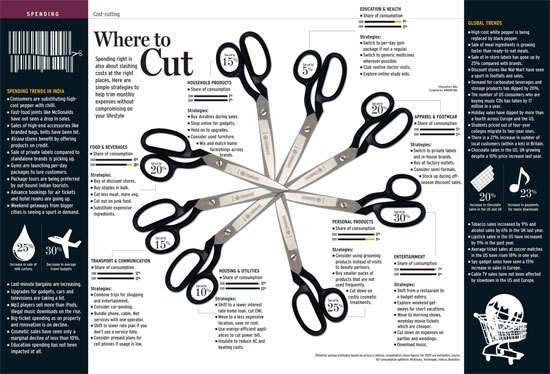
40. Where to Cut
Consumer spending trends juxtaposed with Indian consumers.
Resources on infographics
- Information graphics – Wikipedia
- Cool Infographics – A weblog in infographics
- GOOD – Good is a magazine that often presents creative infographics.
- Flickr Diagram Diaries group – a group on diagrams.
- FlowingData – A site dedicated to the presentation of data
Related content
- 8 CSS Techniques for Charting Data
- 10 Useful Flash Components for Graphing Data
- 40 Exceptional jQuery Interface Techniques and Tutorials
47 Comments

Ezra Sandoval
May 11th, 2009
These are great. I really enjoyed the variety and creative approach to the info graphics. It’s rare that I have to do anything like this, but the next time I do I’m going to definitely use some of these for inspiration.
Great post.

Sita
May 11th, 2009
really useful reference, thanks!

112mirabela
May 11th, 2009
This is a very nice and inspiring collection of infographics. Thank you. :)

RAJ
May 11th, 2009
27. Cover Drive
An illustrated information piece on car insurance coverage in the U.S.
hiii thnx for posting my work here, but the topic is nt abt car insurance as mentioned in the post…
its abt an online survey on insurance
thnx :)
Matt
May 11th, 2009
Nice post, thanks for sharing! Good to see creative displays of data! As a note for some, on image 12, when you download the image via directly clicking it saves it as “Periodic_Table_of_Typefaces_large.jpg.jpg” and needs the extra .jpg stripped off in order to be viewed. Doing Save Picture As / Save Image As works fine.

Callum Chapman
May 11th, 2009
I love the illustrated coffee drinks! I’m forever looking at menus in cafés and thinking, how the hell do you pronounce that? So I always go for something I can say! Starbucks is the worse, they’re menu changes every time I go, but their drinks are so nice!
I have the periodic table of typefaces on my wall :)

dr/roné/di/kristu
May 11th, 2009
Thanks for this compilation of wonderful eye catchers.
Kudos, I really appreciate it. :)

kixvix
May 11th, 2009
Cool! School textbooks should have this kind of infographics from now on. They make learning more fun (and easy!)
Thanks for the list. Cheers!

jtj
May 11th, 2009
Very Creative and Inspirational… I love the way that information can be turned into art…

Ukwelii
May 11th, 2009
This is great collection. Excellent stuff. Stumbled for sure.
Thanks for sharing!

Ron Creel
May 11th, 2009
This is an excellent collection of what I consider InfoPorn. For lazy readers, such as myself, this is a great way to present useful information and show relationships.
See also: http://www.yourwritingdept.com/blog/?p=339 Infoporn: Presenting raw data with visually stimulating graphs.
Thanks,
Ron
Anthony Latona
May 11th, 2009
These are all excellent! I have to bookmark and come back a few time to get to all of them. Very cool information presented in very creative ways. Great post!

Kris
May 11th, 2009
this is a great colection,also visit this—
http://icarograf.deviantart.com/gallery/#Infographic-F1
http://icarograf.deviantart.com/gallery/#Infographic-Micelanius

Jeff
May 12th, 2009
On Driving: Automobile History -> i just like to ask what software / image editing is used to make those boxes..
dr/roné/di/kristu
May 13th, 2009
Back again to re-thank for your helpful links as well! Just stumbled upon after goign through my print edition of this posting.

Sneh
May 13th, 2009
Awesome Roundup! I love Infographics …. especially the ones that come in food magazines. They review a new place and showcase a centerfold of hand drawn map of that place with visual pointers “Wine Glasses for Wineries”, “Forks & spoons for Cafes”, “Ornate French Number Signs for Bed & Breakfasts” so on and so forth …. :-)

Evan MacDonald
May 17th, 2009
This is great! Some seem to be interesting only for the information displayed. some only seem to be interesting in the way it’s displayed, some are great on both accounts!

svario
May 21st, 2009
if u really like this kind of stuff… well you really don’t want miss this.Is a laboratory of the Polytechnic of Milan, which produces stunning infographics, visualmaps and infovis:
check also their flickr:
http://www.flickr.com/photos/densitydesign/and try this great interactive infovisualization:
http://madrid.citymurmur.org/
gamesfreak
May 21st, 2009
this is awesome!! what info graphics!! what illustrations! mind blowing! brilliant detailing!

Daniel Hertzberg
May 28th, 2009
Very inspiring. Thanks so much for grouping these all together. If only Starbucks made that coffee graphic earlier…

Edo
June 1st, 2009
Very Nice!

Paul Horn
June 4th, 2009
Hey thanks! I appreciate the inclusion but compared to the other 39 examples — I’m not worthy!
Some of these are head-exploders. In a good way.

Mark Alan Effinger
June 7th, 2009
Brilliant!
We’ve been fortunate to spend some time with Http://www.Xplane.com. It’s great to see many of Chairman Dave Gray’s concepts realized in these infographics.
Add http://www.Lilipip.com and http://www.CommonCraft.com, and you’re on a visually dynamite roll. A Pacific Northwest Roll at that (sounds very, uh, sushi, don’t it?)
Thanks for the phenomenal resource, Jacob!
Mark Alan Effinger
June 7th, 2009
Brilliant!
We’ve been fortunate to spend some time with http://www.Xplane.com. It’s great to see many of Chairman Dave Gray’s concepts realized in these infographics.
Add http://www.Lilipip.com and http://www.CommonCraft.com, and you’re on a visually dynamite roll. A Pacific Northwest Roll at that (sounds very, uh, sushi, don’t it?)
Thanks for the phenomenal resource, Jacob!
Best,
Mark Alan Effinger
http://www.RichContent.tv/search
Anders
April 15th, 2010
Strange. I though most of these did not fit the description “By presenting information in a compact approach, infographics are able to quickly convey knowledge…”. The coffee one (no. 1) was pretty quick to convey information, but the other ones? For example, the “Who’s coming to America” (no. 20): What does the graphic do? The bars there doesn’t help at all to compare the countries without looking at the numbers on the bar. As far as I can tell, the coutries aren’t ranked in any other way. And why are the “other countries” not divided into bars like the rest; it stretches over four bars in width with no space? Also, the bars leaves out much of the information that’s listed next to the flags. A good designed table would much quicker convery this information and make comparising easier. And there are also a number of graphs that could convey the same information much better.
So, artistic and creative? Yes, maybe. But conveying information quickly in a compact way? Not so much. In my opinion.

Dr. Jochen L. Leidner
June 14th, 2010
Most of these are very educational, and indeed well-presented. One criticism I’d like to throw into the discussion is that a lot of them are quite crowded/overloaded.
I recommend the book by Tufte, “The Visual Presentation of Information” for advice…
-Jochen

Photo Club
June 15th, 2010
31. Evolution of the Household – 1950’s to Present – looks awful and not informative at all… Scrolling up and down is frustrating :(
Liked “Coffee” one very much! :)
Leave a Comment
Tuesday, June 15, 2010
40 Useful and Creative Infographics


via sixrevisions.com
Subscribe to:
Post Comments (Atom)
No comments:
Post a Comment